Debugging AI Agent Execution Traces
How full execution traces reveal hidden failures in AI agent systems.
Debugging an AI agent has nothing in common with debugging a normal program. Agents don't fail the way a null pointer fails, clean and reproducible. They fail in ways that pass every health check while being completely, confidently wrong, and that difference is the whole story.
Traditional debugging tools assume a system behaves the same way twice. Breakpoints assume you can pause execution and inspect a variable. Stack traces assume the path from A to B is fixed, and log grep assumes the error actually shows up in a log. Agentic systems break all three assumptions at once, and they don't break them one at a time where you'd notice. They break them simultaneously, which is why a debugging session that should take twenty minutes turns into an afternoon.
Three violations do most of the damage. First, non-determinism: feed an agent the same prompt twice and you can get two different execution paths, because the model's sampling and the agent's tool choices aren't fixed functions. Second, distributed failure: the thing that went wrong might live in an LLM call, a tool call, a retrieval step, or a child agent several layers down, and each layer fails in its own particular way. Third, and worst, silent success: an agent can hand back a fluent, grammatically perfect answer that's just wrong, and every dashboard stays green the entire time.
That last one is the crux of a distinction worth being precise about. Monitoring answers "did the system respond?" Uptime, latency, error rate. Observability answers "was the response any good?" Reasoning quality, tool correctness, whether the agent's internal state still matches reality. An LLM can respond in 400 milliseconds with an answer that's confidently, fluently incorrect, and a monitoring dashboard calls that a win. Most production incidents involving agents trace back to exactly this: someone treated a monitoring green light as proof of correctness, and it wasn't measuring correctness at all.
The cost of getting this wrong is already showing up in survey data. A large 2025 developer survey found that 45% of respondents said debugging AI-generated code takes longer than debugging code they wrote by hand, and developer trust in AI accuracy dropped from 40% to 29% over a single year as that cost compounded. Meanwhile, analyst forecasts put agent adoption inside enterprise applications jumping from under 5% in 2025 to 40% by the end of 2026. That's not a gradual ramp, that's a cliff, and ad-hoc debugging (someone staring at logs, hoping) does not scale to a cliff.
What actually goes wrong: a working taxonomy of agent failures
Without a taxonomy, debugging an agent is vibes-based pattern matching. Something looks weird, you guess, you poke around, hoping something sticks. With a taxonomy, a given failure symptom points to a specific layer of the system, and debugging turns into something closer to a checklist.
The most systematic public study of this, the MAST taxonomy, presented at NeurIPS 2025, annotated 1,642 execution traces across seven agent frameworks and found 14 distinct failure modes sorted into three categories. Failure rates ranged from 41% up to 86.7% depending on which framework was tested. Read that again: these aren't rare edge cases hiding in a corner, failure is the norm. The single biggest category, at 44.2%, was system design issues, ahead of both inter-agent misalignment and gaps in task verification. Most of what breaks isn't a smarter-model problem. Swapping in a better LLM doesn't fix a structural design flaw any more than a faster car fixes a broken map, and teams that keep upgrading models to chase down bugs are solving the wrong layer.
Then there's the quieter, nastier problem: failures nobody can even see. A benchmark called MAESTRO found that 75.17% of failures show up as "silent gray errors," meaning nothing about them triggers an explicit system failure. Picture two agents reading from the same shared state. Both make perfectly reasonable updates, and one write lands a beat after the other and quietly overwrites it. The final output is syntactically clean, part of the actual work is just gone, and there isn't a single error log entry to show for it. These are the failures that actually take down production systems, because they sail through automated checks and only get caught when a human notices or a user complains loudly enough.
Error propagation makes this worse. A tool call can fail without raising an exception, so the agent carries stale or wrong data forward like nothing happened. By the time the wrong answer surfaces at the top of the trace, it might be a dozen steps removed from whatever actually caused it. A newer taxonomy called TRAIL, built from turn-level traces, breaks failures into reasoning, planning, and execution categories, and one of its more sobering findings is that even strong long-context models struggle at trace debugging. The thing that made the mistake often can't spot the mistake, even handed the whole transcript.
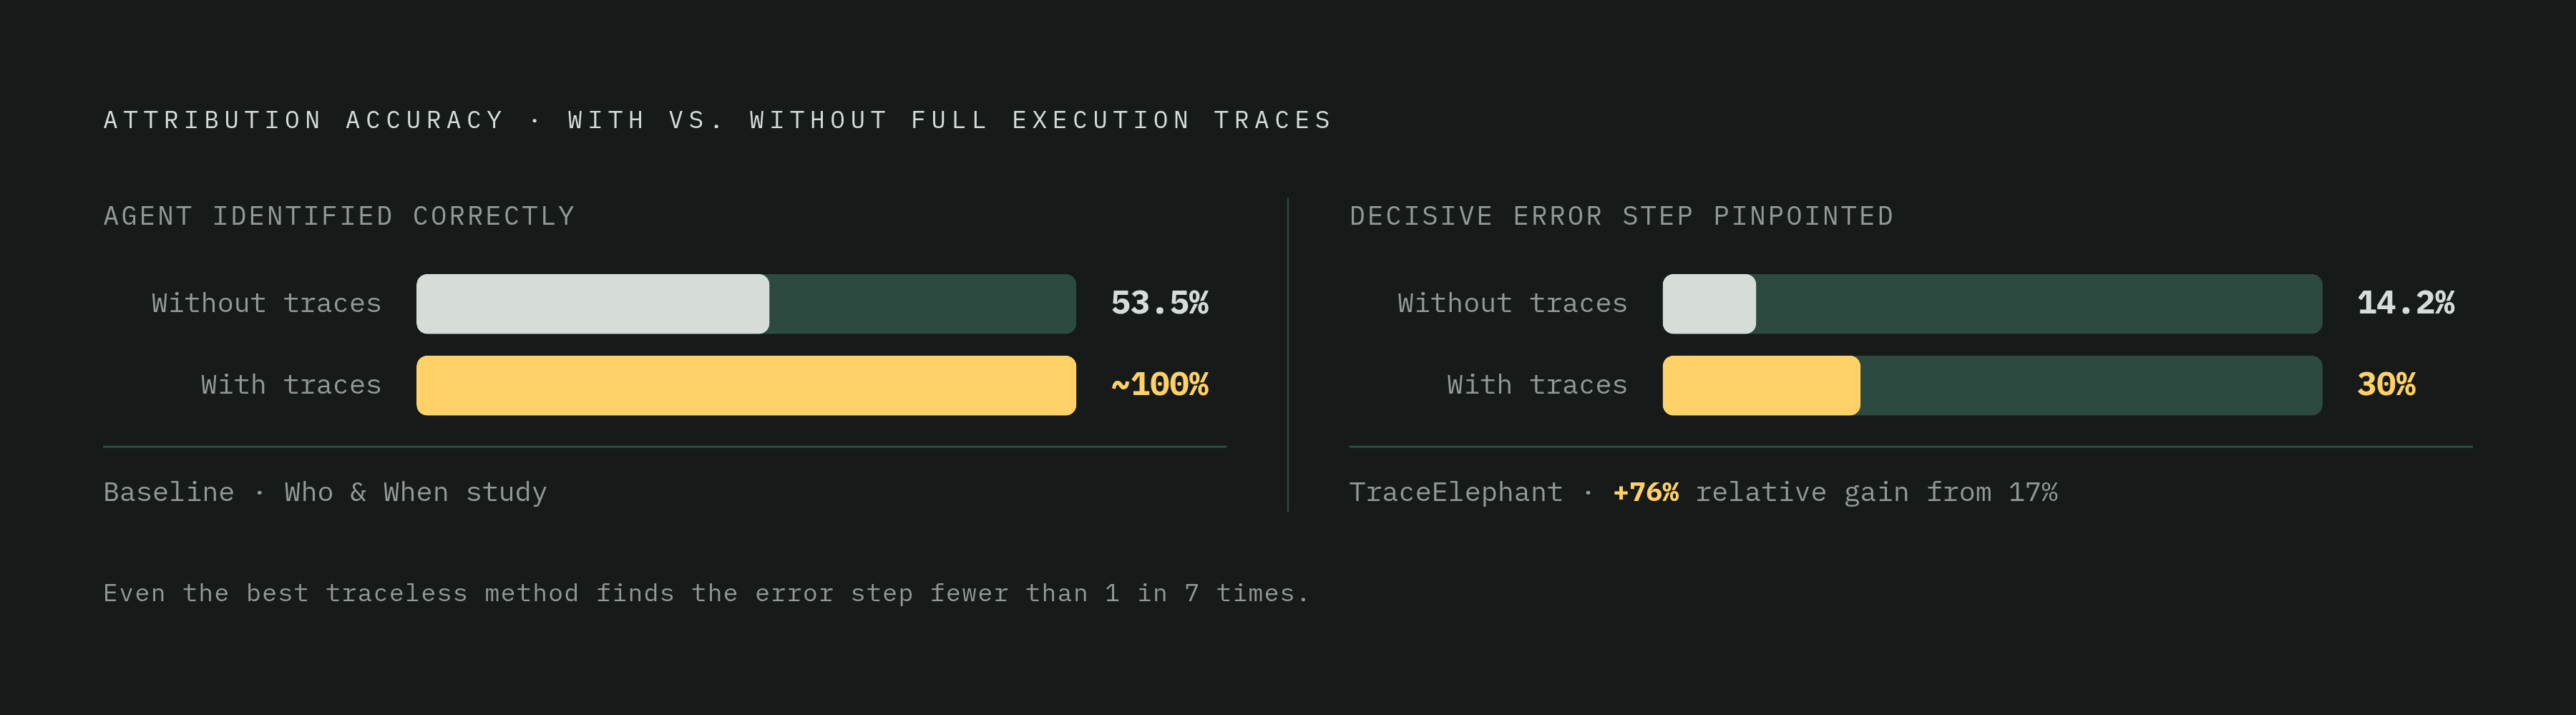
Attribution, meaning figuring out which agent and which step actually caused the failure, is still mostly unsolved, and it's worth saying plainly: most attribution tooling on the market today oversells what it can do. A 2025 study called "Who & When," presented at ICML, tested attribution methods against 184 annotated failure cases pulled from 127 multi-agent systems. The best method correctly identified the responsible agent 53.5% of the time, and pinpointed the actual decisive error step in just 14.2% of cases. A separate piece of work, TraceElephant, showed that giving attribution methods access to full execution traces, instead of just the final output, raised step-level attribution accuracy from 17% up to 30%, a 76% relative improvement. Full traces aren't a nice-to-have. They're the difference between guessing right one time in six and guessing right roughly one time in three, and even the better number leaves most of the detective work on your plate.
The anatomy of an execution trace and what each layer tells you
Tracing an agent happens at three levels of zoom, and knowing which level you're looking at saves a lot of confusion.
LLM tracing is the tightest zoom: one model call, the prompt that went in, the completion that came out, token counts, latency. Pipeline tracing widens the view to a full multi-component flow, so the LLM call sits alongside retrieval, re-ranking, and tool invocations. Agent tracing is the widest angle: the entire decision-making process across multiple turns, including the agent's reasoning, its plan state, which tools it picked, and how each action changed the world it's operating in.
Underneath all three sits the span-tree model, and everything else builds on it. Every operation, whether an LLM call, a tool invocation, a retrieval step, or a reasoning pass, gets recorded as a span. Spans nest into a tree: a root span for the overall agent run contains child spans for each sub-operation, and those children can have their own children. Correlation IDs, injected at the gateway layer, tie every event from a single agent run into one hierarchical trace, instead of leaving a pile of disconnected requests that happen to have occurred around the same time.
In practice, this reads as a waterfall chart, where time runs left to right and nesting shows which operation triggered which. A typical shape might look like retrieve_kb taking 280 milliseconds, containing a vector_search at 150 milliseconds, followed by an openai.chat.completions.create call that eats 820 milliseconds. Spotting a timing anomaly, a span that should take twenty milliseconds but takes four seconds, is faster by eye in a waterfall than it will ever be by grepping logs. But that only works if the tool calls are actually in the trace as spans. Here's the thing nobody wants to hear: a trace missing tool spans doesn't just have a gap, it hides exactly the failure modes that matter most. Every tool needs to be a first-class span, not a line buried in application logs.
Here's what that looks like when it goes wrong. This pattern plays out repeatedly in practice: a tool fails silently, the agent reasons forward on bad data, and nothing in the logs flags an error because the tool was never instrumented as its own span. Once it is, the problematic span stands out immediately in the waterfall.
At minimum, a well-formed span needs to capture the operation type and name, its inputs (the prompt, the tool arguments, the retrieval query), its outputs (the completion, the return value, the retrieved chunks), a start time, duration and status, and a correlation ID linking it to its parent and any children it spawns. Skip any of those and the debugging is half-blind from the start.
Instrumentation standards that make traces portable and comparable
Here's the problem nobody loves talking about: without a shared schema, every vendor invents its own shape for a span's attributes. A trace produced by one framework can't be read by tooling built for a different one, so switching tools means starting instrumentation over from scratch.
OpenTelemetry's GenAI Semantic Conventions are the industry's attempt to fix that. The GenAI Special Interest Group formed in April 2024, and its scope has since grown from tracing LLM client calls to covering agent orchestration, MCP tool calling, content capture, and quality evaluation, six layers in total. As of May 2026, both the GenAI and MCP conventions are still marked "Development" status, not stable, which means the attribute names underneath them can still shift. The practical move is to build against them now for interoperability's sake, but wrap the instrumentation in its own layer so a schema change upstream doesn't ripple through the entire codebase.
OpenInference takes a different angle on the same problem. It's an open-source semantic convention specification, built on top of OpenTelemetry but designed from day one around LLM and agent workloads specifically. It standardizes the exact shapes agent systems tend to produce: LLM calls with full prompt and completion detail, retrieval steps, re-ranking steps, tool calls, multi-step chains. It has an active open-source community behind it, broad auto-instrumentation support across popular agent frameworks, and it iterates faster than the more formal OTel standards process allows.
One gap worth naming specifically: MCP tracing. Until recently, a team could trace the client side of an MCP call, or the server side, but the moment a client called into an MCP server, visibility dropped off a cliff. Purpose-built instrumentation can close that gap by propagating OpenTelemetry context across the MCP wire protocol itself, stitching client-side and server-side spans into one continuous trace. Without that bridge, a tool failure originating inside an MCP server just looks like an unexplained gap in the client trace, an empty patch of nothing where the answer should be.
The good news: these two approaches are converging rather than competing. OpenInference instrumentations already emit both their own attributes and the OTel GenAI attributes side by side, purely for backward compatibility. Once the OTel GenAI conventions hit stable status, the practical payoff is instrument once, route anywhere, with the same telemetry stream feeding a self-hosted tool and a managed backend at the same time, no duplicate work. For a team picking a strategy today, either convention gets there eventually. The real decision comes down to which community ecosystem fits and how much stability the team needs right now versus later.
A systematic workflow for tracing a failure from symptom to root cause
There's a fast path here, and it works the same way every time, which is exactly the point.
Start with capture: instrument every operation as an OpenTelemetry span before touching anything else. A trace with holes in it, missing tool spans especially, will actively mislead rather than just leave a gap. Next, visualize: pull up the waterfall view and find the first span showing something off, an unexpected duration, an error status, a child span that should exist but doesn't. Then follow the propagation: trace every parent span that inherited the failed state, and separate the origin span, where the problem actually started, from the symptom spans, where it just happened to surface.
From there, diff against a known-good run. Line the failing trace up next to one that succeeded and compare structure, attributes, timing, since differences narrow the search space fast, often faster than staring at the failing trace in isolation ever could. Finally, hypothesize and replay: pick one specific theory about the root cause, change exactly one variable, and run it again. The goal is making the failure reproducible on demand before touching a fix, because a fix for a bug nobody can reproduce is really just a guess wearing a lab coat.
Once the failing span turns up, classifying what kind of failure it is tells you where to look next. A reasoning failure means the model drew a wrong conclusion; check the prompt span and whatever context got passed in, since this is often a retrieval problem or a context-window problem wearing a reasoning-failure costume. A planning failure means the agent picked the wrong sequence of tool calls; check the plan state at each turn, and expect this more when instructions were vague or too broad. A tool execution failure means the tool itself returned something wrong, stale, or null; check the tool's input and output spans directly, because this kind of error is almost always invisible at the LLM span. A state transition failure means shared state got overwritten, partially updated, or read out of order; this shows up most in multi-agent setups, and the tell is concurrent writes hitting the same state key.
Some platforms make the propagation step less manual by design, marking every parent span that inherited a failure and every sibling span that came through clean, which turns "trace this by hand" into "read this chart." That matters because non-determinism means a single re-run might just not reproduce the bug, so run the same input several times and watch for the one span whose output changes between runs. And log the full prompt plus every tool input as span attributes from the start; it's the only reliable way to replay the exact conditions that triggered the failure later.
Time-travel and checkpoint debugging for flaky, stateful agents
Some failures only show up after a very specific sequence of prior steps, which makes them expensive or flatly impossible to reproduce from a cold start. That's the exact problem checkpoint debugging exists to solve.
In a stateful agent framework like LangGraph, every state change creates a checkpoint, a full snapshot of exactly what the agent knew and held at that moment. Time-travel debugging lets a developer jump to any checkpoint, inspect the state as it existed then, tweak an input, and resume execution from that exact point forward. It behaves like three tools stacked into one: a debugger, an undo button, and an audit log, all reading from the same underlying data.
The original run stays intact in the database the whole time, preserved for auditing. Resuming from a modified checkpoint doesn't erase history; it forks into a new branch, leaving the original timeline exactly where it was, which matters if anyone ever needs to know what actually happened versus what would have happened.
Reach for this when a bug only showed up on turn 47 of a long-running conversation, and replaying all 46 prior turns just to reproduce it sounds like a special kind of punishment. It's also useful for counterfactual testing (would a different tool response at step 12 have changed the final answer?) and for state corruption, where the fix is rewinding to the last known-good checkpoint and diffing the state directly. One hard constraint worth flagging: checkpointing has to be turned on before the failure happens. There's no retrofitting time-travel onto a run that was never persisted in the first place; you can't excavate a fossil that was never buried.
This connects directly back to the attribution gap. Remember the "Who & When" numbers: even the strongest method identified the actual decisive error step in only 14.2% of cases. Checkpoint inspection is usually the manual work that closes that gap, since a human looking at the exact state at the exact moment things went sideways can often spot what an automated attribution method misses entirely.
Interactive debugging with human-in-the-loop intervention
Automated tracing gets most of the way to root cause, but it doesn't close every gap on its own, especially as agent conversations stretch longer. The longer a conversation runs, the more state accumulates, and the more a purely automated trace turns into a haystack even with good instrumentation.
That's where human-in-the-loop debugging earns its keep. Rather than waiting for a failure to fully play out and reconstructing it after the fact, a developer can pause an agent mid-execution, inspect its current plan and state directly, and either approve the next step or redirect it on the spot. It's less like reading an accident report and more like grabbing the wheel before the car hits the guardrail.
The combination is what makes agent debugging tractable at all: automated tracing narrows down where to look, checkpointing rewinds to any exact moment, and human intervention lets someone step in and correct course in real time instead of just documenting the wreck afterward. None of these three tools alone solves the debugging problem agents create. Together, they're the closest thing the field has to a systematic answer, and any team betting on just one of the three is betting against the odds already laid out above.