Monitoring and Observability for Self-Hosted Agent Systems
Data residency and quality monitoring drive self-hosted observability adoption.
There are two ways to handle agent telemetry. You can ship it to a cloud-hosted SaaS; or you keep it inside your own infrastructure. For a lot of teams, the second path isn't a preference; it's the only option. Think of it this way: choosing between cloud-hosted and self-hosted telemetry is like choosing between renting a safe-deposit box at someone else's bank or keeping your valuables in a vault you built yourself. One is convenient; the other is yours.
The reason usually comes down to data residency. Trace data, audit logs, model interaction records. All of it has to stay inside a defined perimeter. And here's the thing people consistently underestimate: a vendor contract doesn't actually solve this. Legal compulsion operates on physical possession, not contract language. The US CLOUD Act is the concrete example; US authorities can compel American providers to hand over data even when the servers are physically sitting in Frankfurt or Sydney. EU residency alone doesn't close that gap.
Regulatory pressure is making self-hosted observability a procurement filter, not just a technical preference:
- The EU AI Act (Regulation 2024/1689) kicks in broadly starting August 2026 and brings documentation and audit-trail obligations with it.
- DORA and NIS2 add their own documentation requirements for financial services and critical infrastructure.
- Cross-border data transfer compliance keeps showing up as a top regulatory headache for organizations running in multiple jurisdictions.
Then there's cost structure, which sneaks up on teams. Agent chains have gotten dramatically longer. What used to be a single LLM call is now a workflow with branching logic, multiple agents, tool use, and retry loops. Per-execution SaaS pricing scales linearly with that complexity. At some volume, the math stops working and you're paying a lot of money to watch your own agents.
The practical upshot: self-hosted observability isn't just a deployment preference; it shapes which tools are even viable, what data you're legally allowed to retain, and how you produce audit evidence when someone asks for it.
What to Actually Measure: The Signal Layer Agents Require
Most teams have one of the two signal categories they need; rarely both.
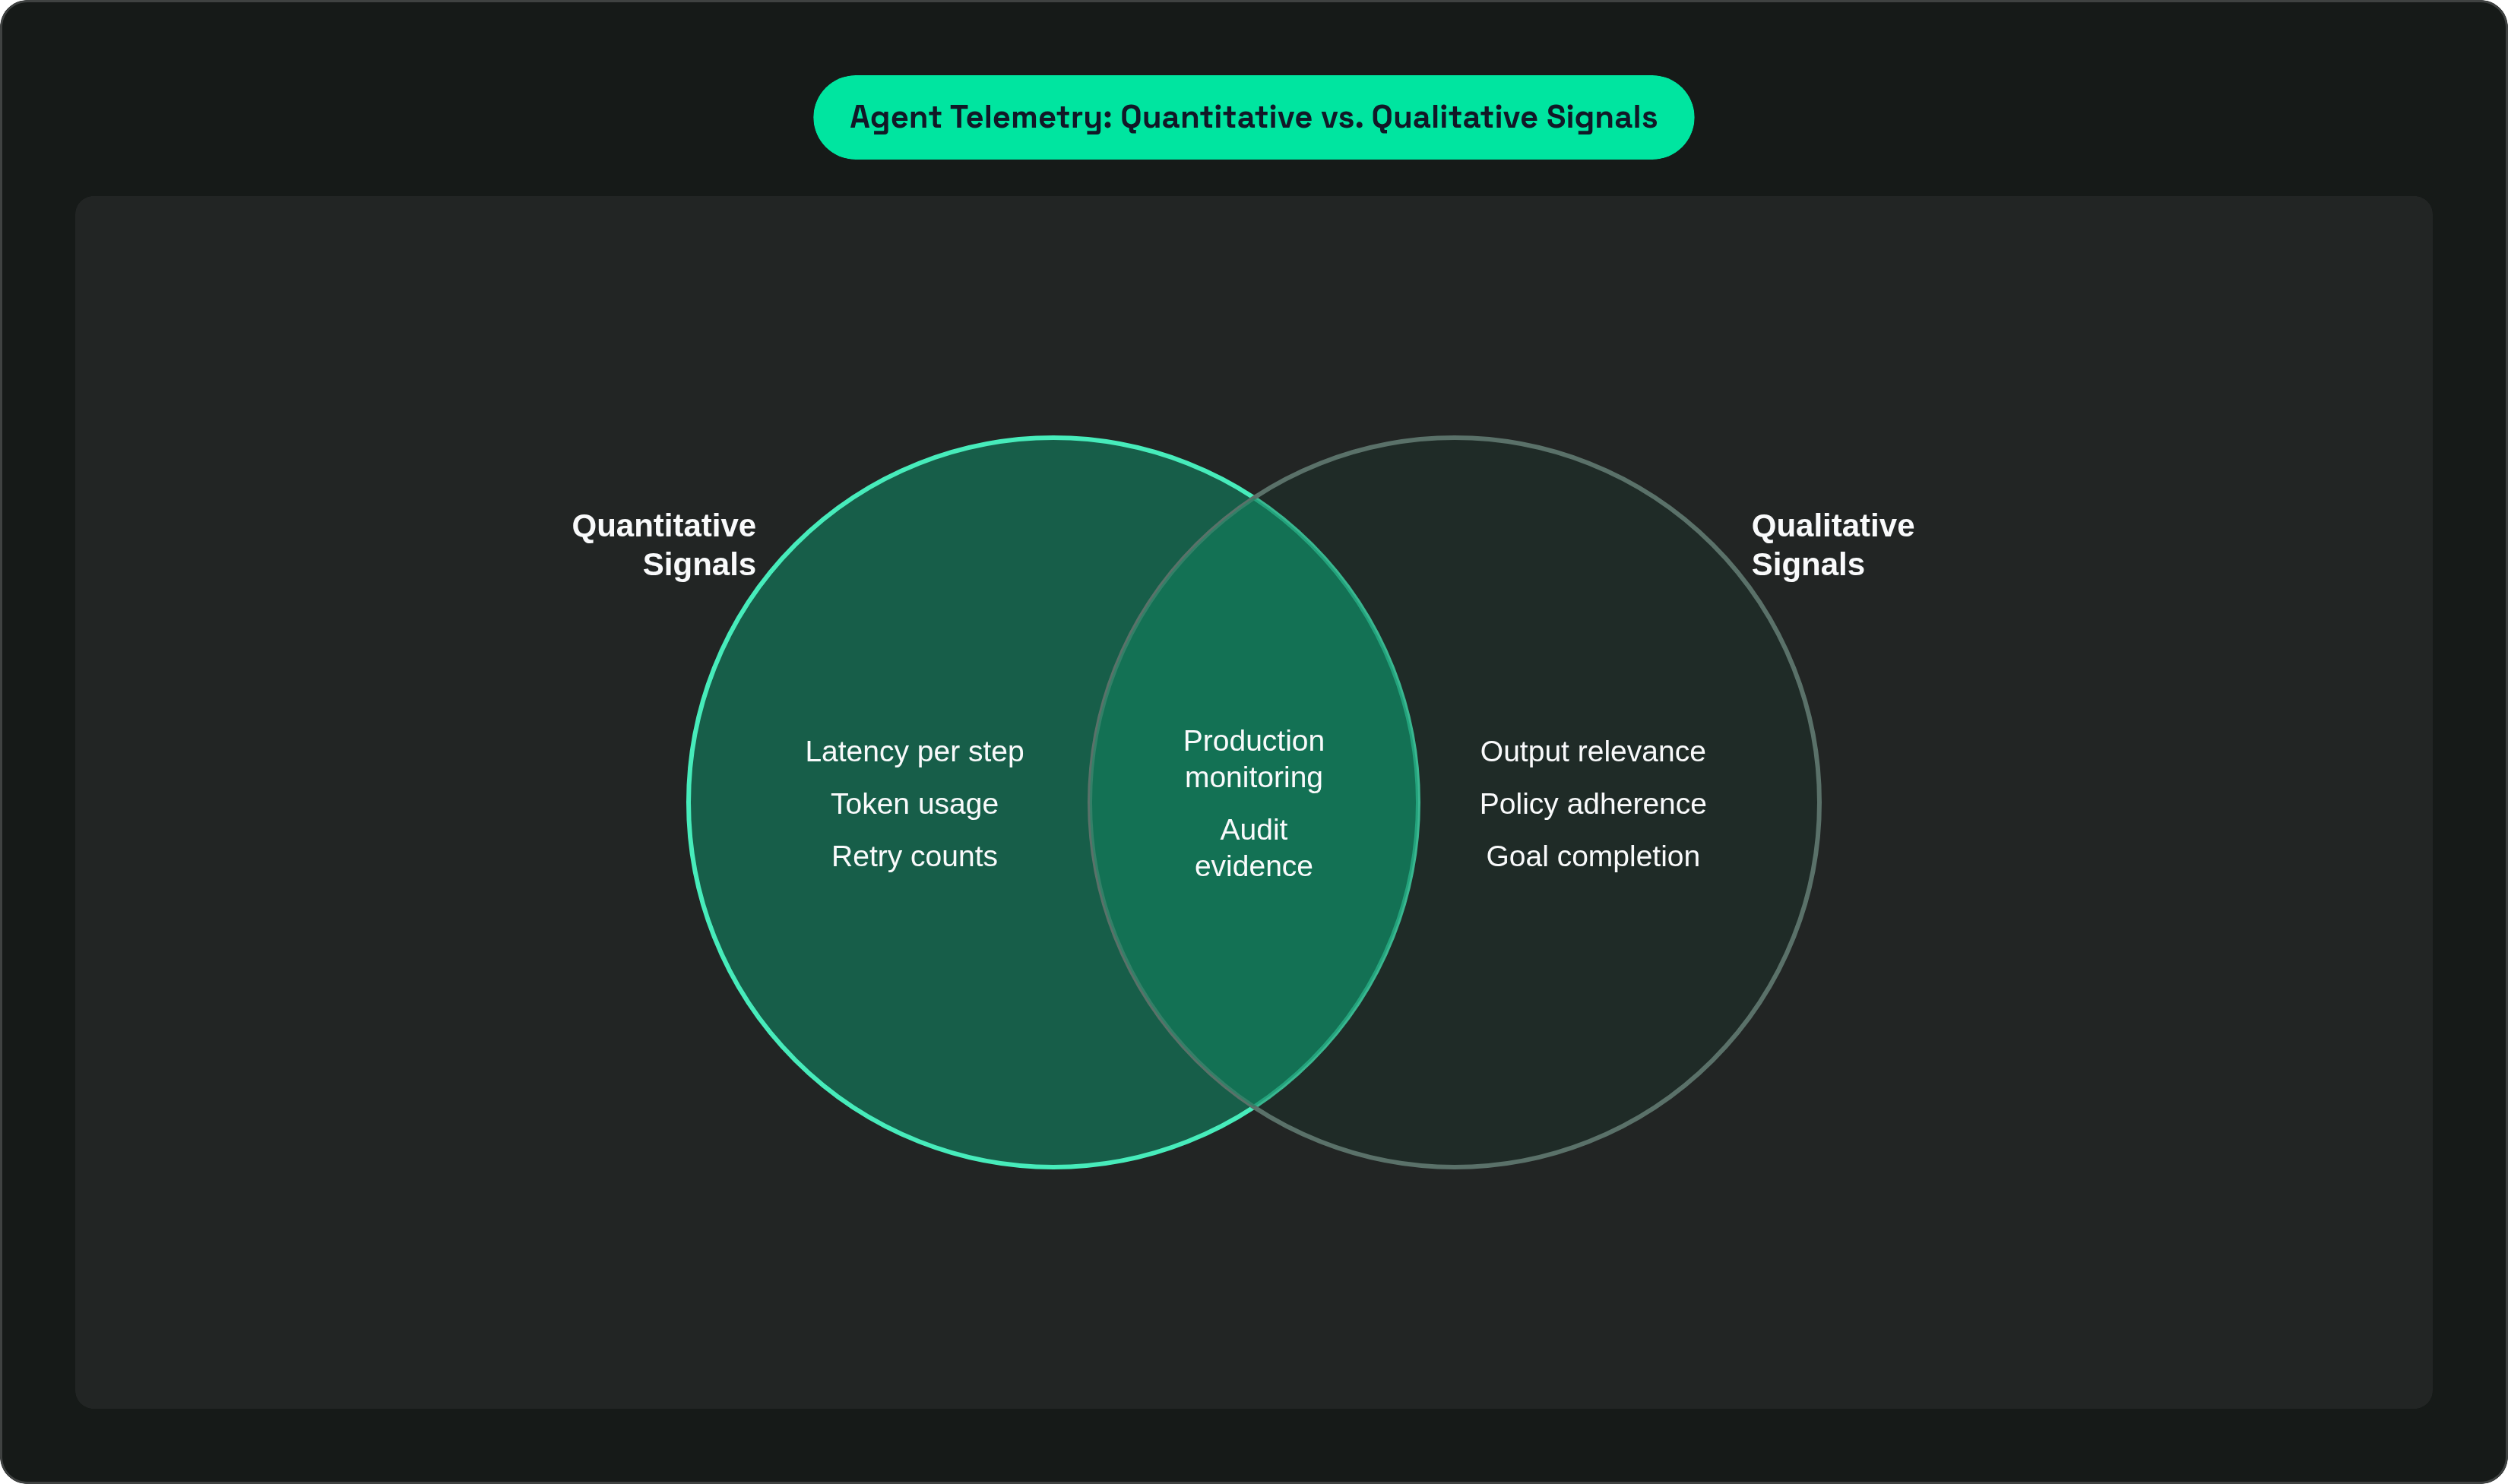
Quantitative signals are the familiar ones. Latency per step, token usage per run, cost per execution, success/failure rates, retry counts. Measurable, alertable, easy to store. Most teams have these covered.
Qualitative signals are where things get harder. Output relevance, factual accuracy, policy adherence, goal completion. These don't show up in logs without deliberate evaluation. You have to build for them on purpose, and most teams don't until something breaks.
LangChain's 2026 State of Agent Engineering survey (over a thousand professionals) found that output quality is cited as the dominant production barrier. More often than cost. More often than latency. More often than infrastructure concerns. That result has stuck with me because it matches what I've seen: teams will optimize latency for months while quality quietly degrades and nobody notices until a user complains. Chasing latency while quality erodes is like polishing the hood of a car with no engine — it looks fast, but it isn't going anywhere.
The failure modes that quantitative metrics alone will miss:
- Correct output, wrong latency. An agent that responds correctly in 60 seconds when users expect 10 has still failed.
- Correct output, wrong data handling. A response that leaks PII has failed even if every metric is green.
- Correct output, wrong tool. An agent that accomplishes the task via an unauthorized API call has failed on governance grounds. Your dashboard will never know.
Teams that evaluate thoroughly before launch and then stop monitoring post-launch see quality degradation within weeks; evaluation has to be operational, not occasional. Deloitte's AI Ops Maturity analysis found that continuous evaluation reduces production incidents by 67% compared to periodic evaluation. Gartner projects that by 2030, half of AI agent deployment failures will trace back to insufficient runtime governance and observability specifically. Missing guardrails during execution. That's a specific and sobering number to sit with.
Tracing Multi-Step Agent Workflows: Spans, Sessions, and Where Traces Break Down
A single log line doesn't cut it for agents. When one user request fans out into orchestrator calls, tool invocations, model calls, and memory reads, you need to see the entire execution tree; you need to understand how each step relates to the others.
Distributed tracing, adapted for agents, is the right mental model. Every agent run should produce a trace: a tree of spans, each representing a sub-operation. The span types that matter:
- Orchestrator span. The parent. Everything else hangs off this.
- Tool spans. Each tool invocation gets its own span.
- Model call spans. Every LLM call, separately tracked.
- Retrieval spans. Vector store lookups, document fetches.
- Memory read/write spans. If your agent has memory, you want to see when and what it reads.
Session grouping matters too. Multiple traces belonging to a single user interaction need to be linkable; without that, debugging a multi-turn conversation is a scavenger hunt across disconnected log entries.
Where Agent Traces Actually Break Down
Branching logic. Agent decisions create conditional paths. A trace visualizer that only shows linear sequences misses this entirely; you need to see the paths not taken, not just the one the agent chose. Most visualizers don't show you this by default.
Retry loops. Failed tool calls that retry silently inflate latency and cost without appearing as errors anywhere. They're invisible tax.
Long-running workflows. An agent that runs for minutes or hours breaks assumptions baked into most tracing backends about how long a span should last; many systems will drop it or truncate it.
Inter-agent calls. Multi-agent systems require trace context to propagate across agent boundaries. This is easy to lose; when you lose it, the trace breaks and you're back to guessing. I've seen teams spend days debugging what turned out to be a missing trace propagation header.
A complete execution record for each run should capture: the triggering event with timestamp, the full agent trace, which tools were called and what data was accessed, which APIs were hit, and what was produced. For retention, 90 days is a reasonable floor for debugging. Regulated industries will need longer; plan for that upfront rather than rebuilding your retention policy later.
OpenTelemetry GenAI Conventions as the Emerging Instrumentation Standard
Here's the problem with having a lot of observability tools from different vendors and frameworks: when every one of them emits telemetry in its own proprietary format, you're locked into whatever you chose first. Switch frameworks mid-project and your entire observability pipeline breaks.
OpenTelemetry's GenAI semantic conventions address this directly. They define four span operation types specifically built for agents:
create_agentinvoke_agentinvoke_workflowexecute_tool
The invoke_agent distinction is worth pausing on; it's marked CLIENT when the agent runs remotely (like a managed API) and INTERNAL when it runs inside your own process. For self-hosted systems, that distinction matters for understanding where your boundaries actually are.
The spec also defines required metrics: latency and token usage. Those are the quantitative baseline for every agent span.
One important caveat: nearly all gen_ai.* attributes currently carry Development stability badges. Attribute names can change without a major version bump; build with that flexibility in mind rather than treating the schema as locked down yet.
The instrumentation overhead is genuinely low for common providers. In Python, a single instrumentor call can produce spec-compliant spans automatically for OpenAI without any manual span creation. Low barrier to entry.
The practical obstacle is framework fragmentation. Some frameworks have tracing built in; others need custom hooks. The defensible strategy is to build your observability layer against OTel conventions rather than framework-specific APIs. That way, when you switch or mix frameworks (and you will), the observability layer survives the change.
Datadog announced native support for OTel GenAI conventions in late 2025, mapping gen_ai.* attributes to its own LLM Observability schema. When commercial tooling starts aligning to a standard, that's a reliable signal the standard has real momentum behind it.
Self-Hostable Observability Tools and What Each One Actually Does
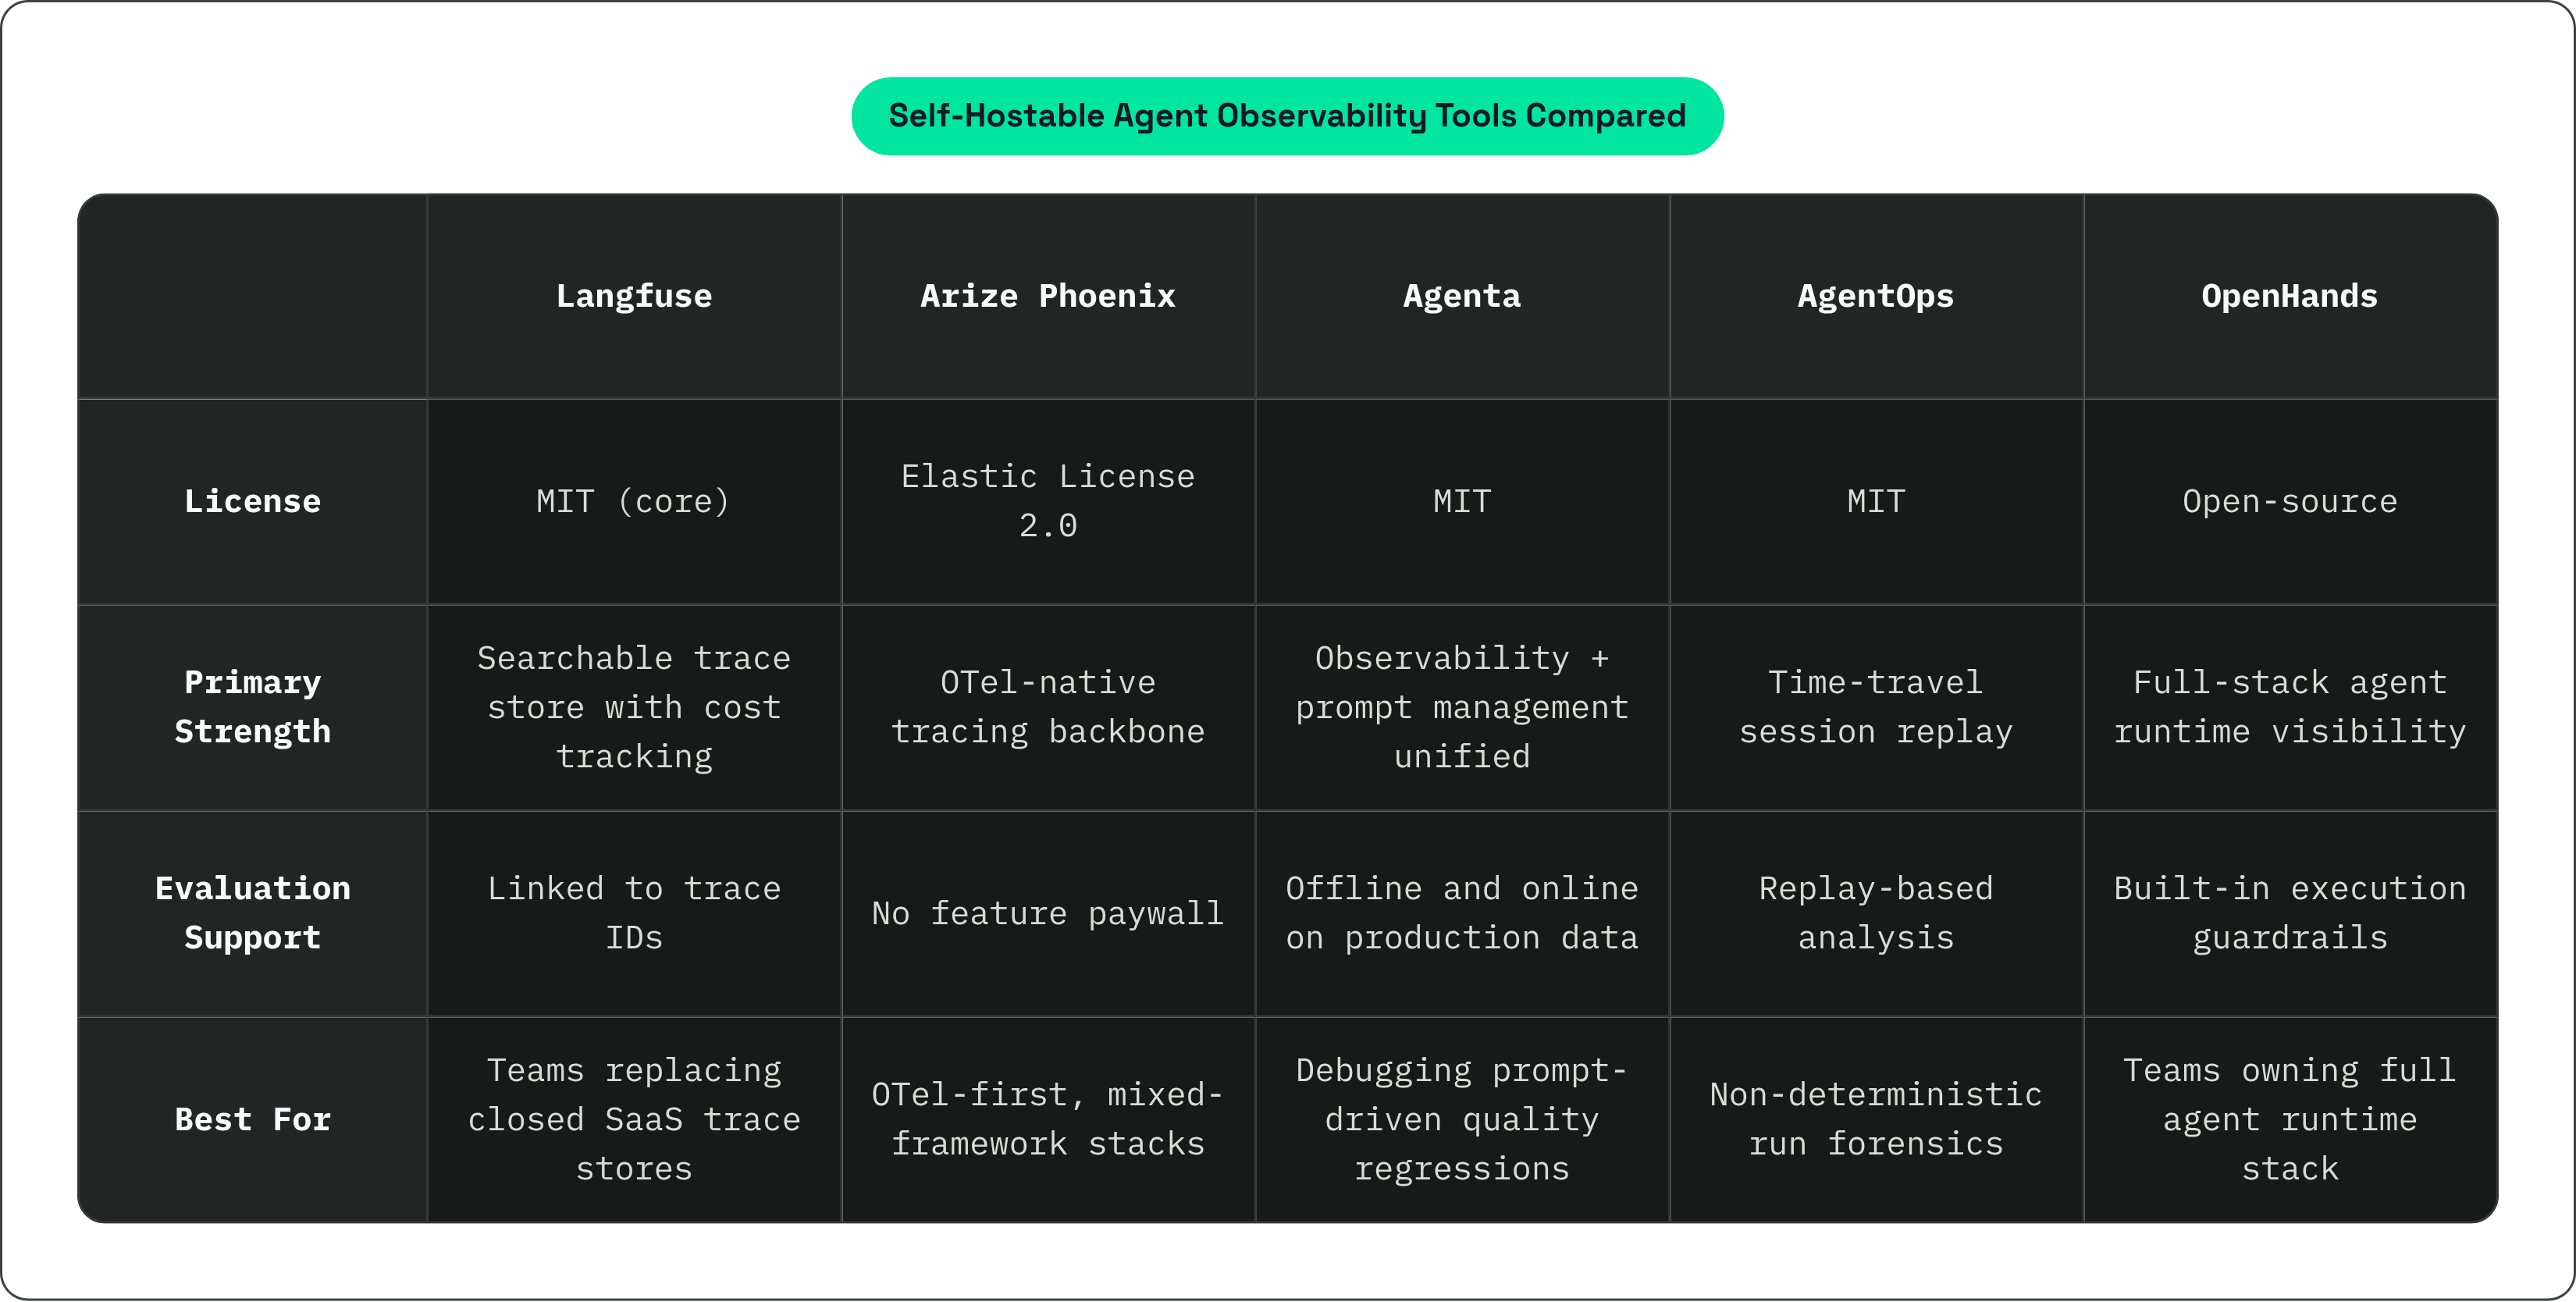
The right tool depends on what your team actually values most. Infrastructure control. Evaluation depth. Debugging capability. Integration breadth. What follows isn't a feature matrix; it's a description of what each tool is actually good at, based on what teams use them for in practice.
Langfuse
MIT-licensed core (with the enterprise folder excluded). Self-hosts via Docker Compose, Kubernetes/Helm, or Terraform. Version 3 introduced asynchronous ingestion with queue-based processing, which makes it genuinely suited for high-throughput production workloads rather than just development use.
If your main pain is "I need a searchable trace store I actually own, with cost tracking and session inspection, without sending data to a closed SaaS," Langfuse is the obvious starting point. Langfuse was acquired by ClickHouse in early 2026; the open-source licensing and self-hosting path are stated to remain unchanged.
Arize Phoenix
Open-source core under Elastic License 2.0. OpenTelemetry-native with OpenInference instrumentation. Fully self-hostable with no feature gates. Arize reports the platform processes roughly a trillion spans per month across its user base, which tells you something about how it performs at scale.
The OTel-first architecture is the real differentiator here; if you want a tracing backbone that plays well with everything else in your stack without a feature paywall, Phoenix is the natural fit.
Agenta
MIT-licensed, self-hostable LLMOps platform. What makes Agenta distinctive is that it integrates observability with prompt management, a prompt playground, and LLM evaluation in the same platform. Prompt versions link directly to traces. It supports both offline and online evaluation on production data.
The reason this matters: most teams have their observability layer and their prompt/evaluation lifecycle in separate tools that don't talk to each other; Agenta puts them together. When you're debugging a quality regression, being able to trace it directly to a specific prompt version is worth a lot.
AgentOps
MIT-licensed. The standout feature is time-travel debugging: replaying an agent session with point-in-time precision. For non-deterministic systems, being able to replay is often the only way to understand what actually happened; you can't reason about a run you can't reconstruct.
If debugging non-deterministic agent runs is your primary pain, this is where to look first.
Datadog LLM Observability
Managed SaaS with enterprise self-hosting options. At DASH 2025, Datadog announced an execution flow chart that visualizes agent run paths including inter-agent interactions, tool usage, and retrieval steps. Automatic instrumentation covers OpenAI Agent SDK, LangGraph, CrewAI, Bedrock Agent SDK, and Google ADK.
The pricing model is worth understanding before you start. Tool spans, embedding spans, retrieval spans, and agent spans are not billed; only LLM spans are. A free tier exists with a meaningful volume of LLM spans per month.
For teams already inside the Datadog ecosystem, adding agent observability here means one less platform to run and maintain. That's a real consideration.
OpenHands (All Hands AI)
Open-source AI coding agent platform. Model-agnostic. Deployable entirely within your own infrastructure. Agent execution visibility and guardrails are built for continuous, long-running workflows.
OpenHands belongs in this list for a specific reason; the observability problem for self-hosted agents starts at the platform level. The platform itself has to expose execution state. Knowing what the agent did, which tools it called, and what it produced requires that visibility to be built in from the start rather than bolted on after. OpenHands treats that as a first principle. Engineering teams that want to own the full stack (agent runtime, infrastructure, and observability layer) without being locked into a vendor's model choices or data handling policies tend to land here.
Building the Monitoring Stack in Practice: What Teams Actually Need to Wire Together
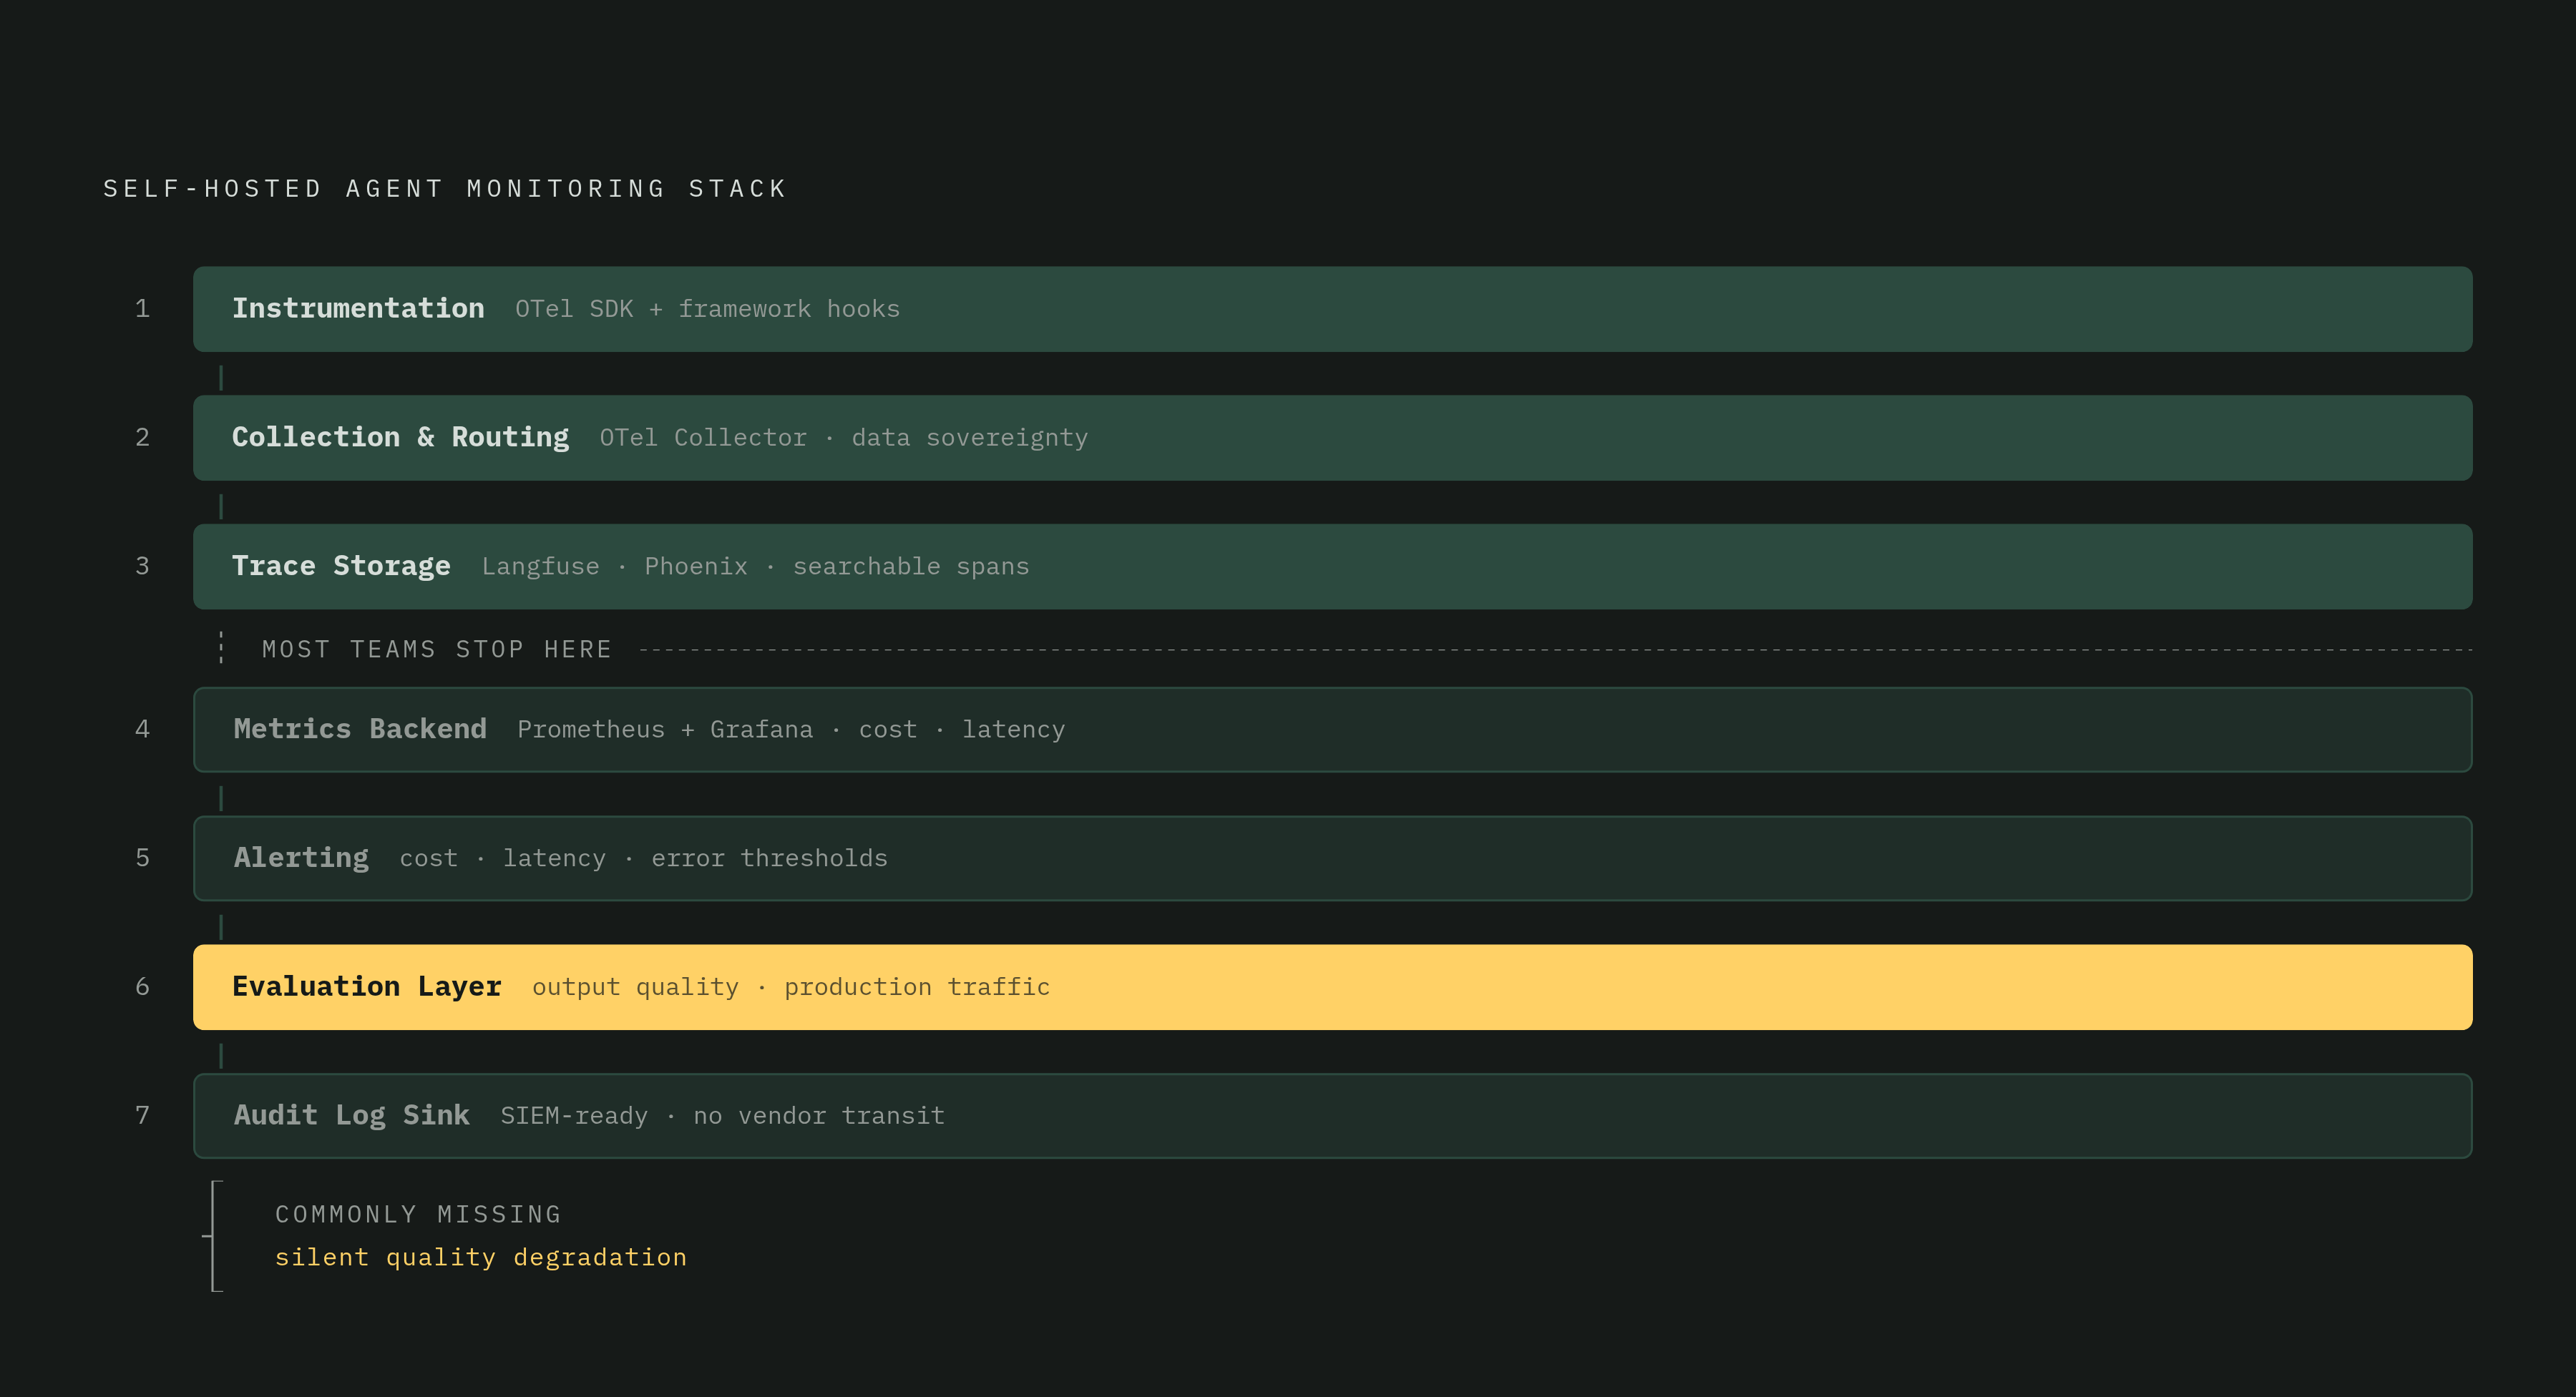
A complete self-hosted agent monitoring stack has seven components; most teams have three of them and wonder why they're still flying blind.
1. Instrumentation layer. OTel SDK plus agent and framework instrumentation. This produces spans, metrics, and logs. It's the source of everything else; if this isn't configured correctly, nothing downstream matters.
2. Collection and routing. An OTel Collector receives the telemetry, filters sensitive fields before they leave the perimeter, and routes data to storage backends. This is where you enforce data sovereignty in practice, not in a contract.
3. Trace storage. A backend that retains spans in a searchable way. The platforms described above are the self-hostable options here.
4. Metrics backend. Time-series storage for latency, token counts, cost, and error rates. Prometheus plus Grafana is the common self-hosted path. It's well-understood and well-documented.
5. Alerting. Thresholds on the metrics that actually matter: cost per run exceeding budget, latency above your SLO, error rate spikes. Agent-behavior alerts, not just infrastructure alerts. The distinction matters.
6. Evaluation layer. A mechanism for scoring output quality on production traffic. Either a separate evaluation pipeline or a platform that integrates this with tracing. This is the layer most teams skip and then regret.
7. Audit log sink. Structured, SIEM-ready logs forwarded to your existing log management. Splunk, Datadog, internal SIEM, whatever you use. The requirement is that these logs never transit vendor infrastructure.
The Hardest Integration Point
Connecting qualitative evaluation back to specific traces is genuinely difficult; flagging a bad output in a production evaluation pipeline is only useful if you can find the exact trace for that run and understand why it happened. Platforms that link evaluation scores to trace IDs directly (Agenta and Langfuse both do this) handle the problem at the platform level. Rolling your own version requires deliberate trace ID propagation through your entire evaluation pipeline. It's doable; it's just not free, and a lot of teams underestimate how much work it is until they're in the middle of it.
What a Useful Incident Record Actually Looks Like
When something goes wrong with an agent, the record you need isn't a stack trace. Every incident record should include:
- The triggering event with timestamp
- The complete agent trace
- Which policy or guardrail evaluation failed, or was absent
- The containment action taken and when
- Root cause determination
- Remediation applied
That structure is what auditors want; it's also what your own team needs to actually fix the problem rather than patch around it until it happens again.
The Governance Gap
Gartner flags this specifically: runtime enforcement is distinct from observability, but it has to be part of the same system. Guardrails that prevent an agent from calling unauthorized tools or accessing data outside its defined scope are what close the loop between watching your agent and actually controlling it.
Observability tells you what happened; governance determines what's allowed to happen. Building one without the other is how you end up with great dashboards and a compliance incident on the same day.