Telemetry Architecture for Autonomous Coding Agents
Mapping the telemetry infrastructure autonomous coding agents require to stay visible and reliable.

Autonomous coding agents are not a future problem; they are a 2025 problem, already running in production, already writing and testing and deploying code, and already failing in ways that no one on your team can see. Andrej Karpathy described going from 80% manual coding to 80% agent-assisted in a single month. Not a gradual ramp. A single month. Gartner projects that 40% of enterprise applications will have embedded task-specific agents by 2026, up from less than 5% in early 2025. That is not a trend; that is a step change. And the engineering teams responsible for keeping those systems reliable are largely flying blind, because the observability stack most of us built over the last decade was not designed for this. This article is about fixing that; specifically, it maps the telemetry architecture you need to make agent execution visible, debuggable, and governable before something quietly goes wrong at scale.
How a technically healthy system can silently fail when an agent is running it
Here is the failure mode that changed how I think about all of this.
A customer-facing agent was confidently telling people their orders had shipped. They had not shipped. Three to four percent of conversations were wrong. Error rate? Zero. Latency? Normal. Every health check was green. The system looked perfectly healthy from the outside.
Six hours of grepping through unstructured logs later, we found it: a tool silently returning cached data from a stale connection pool. The agent had no reason to distrust it. The tool returned a value. The agent used it. Classic garbage-in, garbage-out, except there was no signal anywhere in the stack that garbage had entered. The system was like a smoke detector with dead batteries — everything looked fine right up until it wasn't.
This observability gap is the core problem with traditional APM in agentic systems. APM was built on a deterministic assumption. The same input produces the same output. You instrument the path, you watch for deviations. That model breaks completely when an LLM is in the loop. The same prompt does not reliably produce the same tool call sequence. You cannot declare a run healthy just because it completed.
Think about what one user request actually looks like at the execution level. Five LLM calls. Three tool calls. Two vector database lookups. Any one of those is a potential failure point. A single aggregate error metric cannot tell you which step failed; it can tell you something went wrong. That is about it.
The gap most DevOps tools leave here is specific. They track LLM metrics. They log prompts. What they do not track are agent-specific artifacts: goals, plans, tool states, decision sequences. That is the layer where the interesting failures live.
What actually generates telemetry in a coding agent: the harness, not just the model
The model is not the whole system. This is probably the most important architectural reframe in this entire piece.
When people think about LLM observability, they think about the model API. Tokens in, tokens out, latency, cost. That is necessary; it is not sufficient. What actually runs an agent is the harness. The harness is the infrastructure wrapped around the model. It manages input processing, tool orchestration, context across turns, and result return. The model is a component inside the harness, not the other way around. Focusing only on the model API is like judging a restaurant by whether the oven is working — necessary, but it tells you nothing about the food that actually reaches the table.
Frameworks like SWE-agent, OpenHands, Cursor, and Claude Code all implement some version of an Observe-Think-Act loop, often called a ReAct loop in the research literature. The agent looks at the environment, decides what to do, invokes a tool (bash, file edit, test runner, search), and updates its context with the result. Then it does it again. Each iteration of that loop is a telemetry-generating event: a reasoning step, a tool selection, an execution, a context update. Miss any of those, and you have a gap.
Multi-agent orchestration compounds this. Frameworks like LangGraph, CrewAI, and AutoGen route work across multiple LLM roles through graphs and conversation patterns. Each handoff between agents is a boundary where trace continuity can break. You need distributed tracing across those boundaries, not just within them.
There is also a cost dimension that sneaks up on people. In a multi-turn agent run, context window pressure accumulates. Each turn adds to the context window. Token consumption grows as the run progresses. This means token tracking per step is a functional requirement, not a nice-to-have. If you only track tokens per request, you will not understand your cost structure at all.
The implication for architecture: instrumentation belongs at the harness level. If you only instrument the model API boundary, you are watching the wrong thing.
How OpenTelemetry's GenAI semantic conventions provide the structural foundation for agent traces
OpenTelemetry is the CNCF standard for observability. Traces, metrics, logs. Vendor-neutral instrumentation. You can swap backends without rewriting your instrumentation. That is the whole value proposition, and it matters a lot more in AI systems than it did in traditional software, because the tooling landscape is still chaotic.
Before the GenAI semantic conventions landed, every observability vendor invented their own schema for AI spans. Different attribute names, different span structures, different event shapes. Migrating from one backend to another meant a rewrite, not a config change.
The GenAI semantic conventions changed that. Standardized attribute names, span kinds, and event structures for generative AI, released in late 2025 and adopted broadly through early 2026. The span hierarchy the spec defines is worth knowing:
- A top-level
invoke_agentspan parents the full run - Child spans cover LLM inference, tool execution, and retrieval
- Standardized
gen_ai.*attributes carry model name, token counts, and finish reason
That structure gives you a consistent frame for every agent trace, regardless of which framework generated it.
Now, the honest caveats. As of mid-2026, the spec is still in Development status. Most attributes are marked experimental. Standardized attributes for tasks, actions, agent teams, artifacts, and memory are not yet defined. The GenAI SIG is actively working on multi-agent conventions to fill those gaps, but if you are building now, do not treat those attributes as stable.
On instrumentation paths: some frameworks emit telemetry natively. That is the seamless path. Others require you to import and configure an external instrumentation library (Traceloop and Langtrace are two examples). The choice matters because upgrades propagate differently through the stack depending on which path you took. Know which one you are on before you build around it.
The proxy versus SDK instrumentation decision and what it costs you either way
There are two ways to instrument an agent. Proxy and SDK. Both work. Both have real costs. Neither is free.
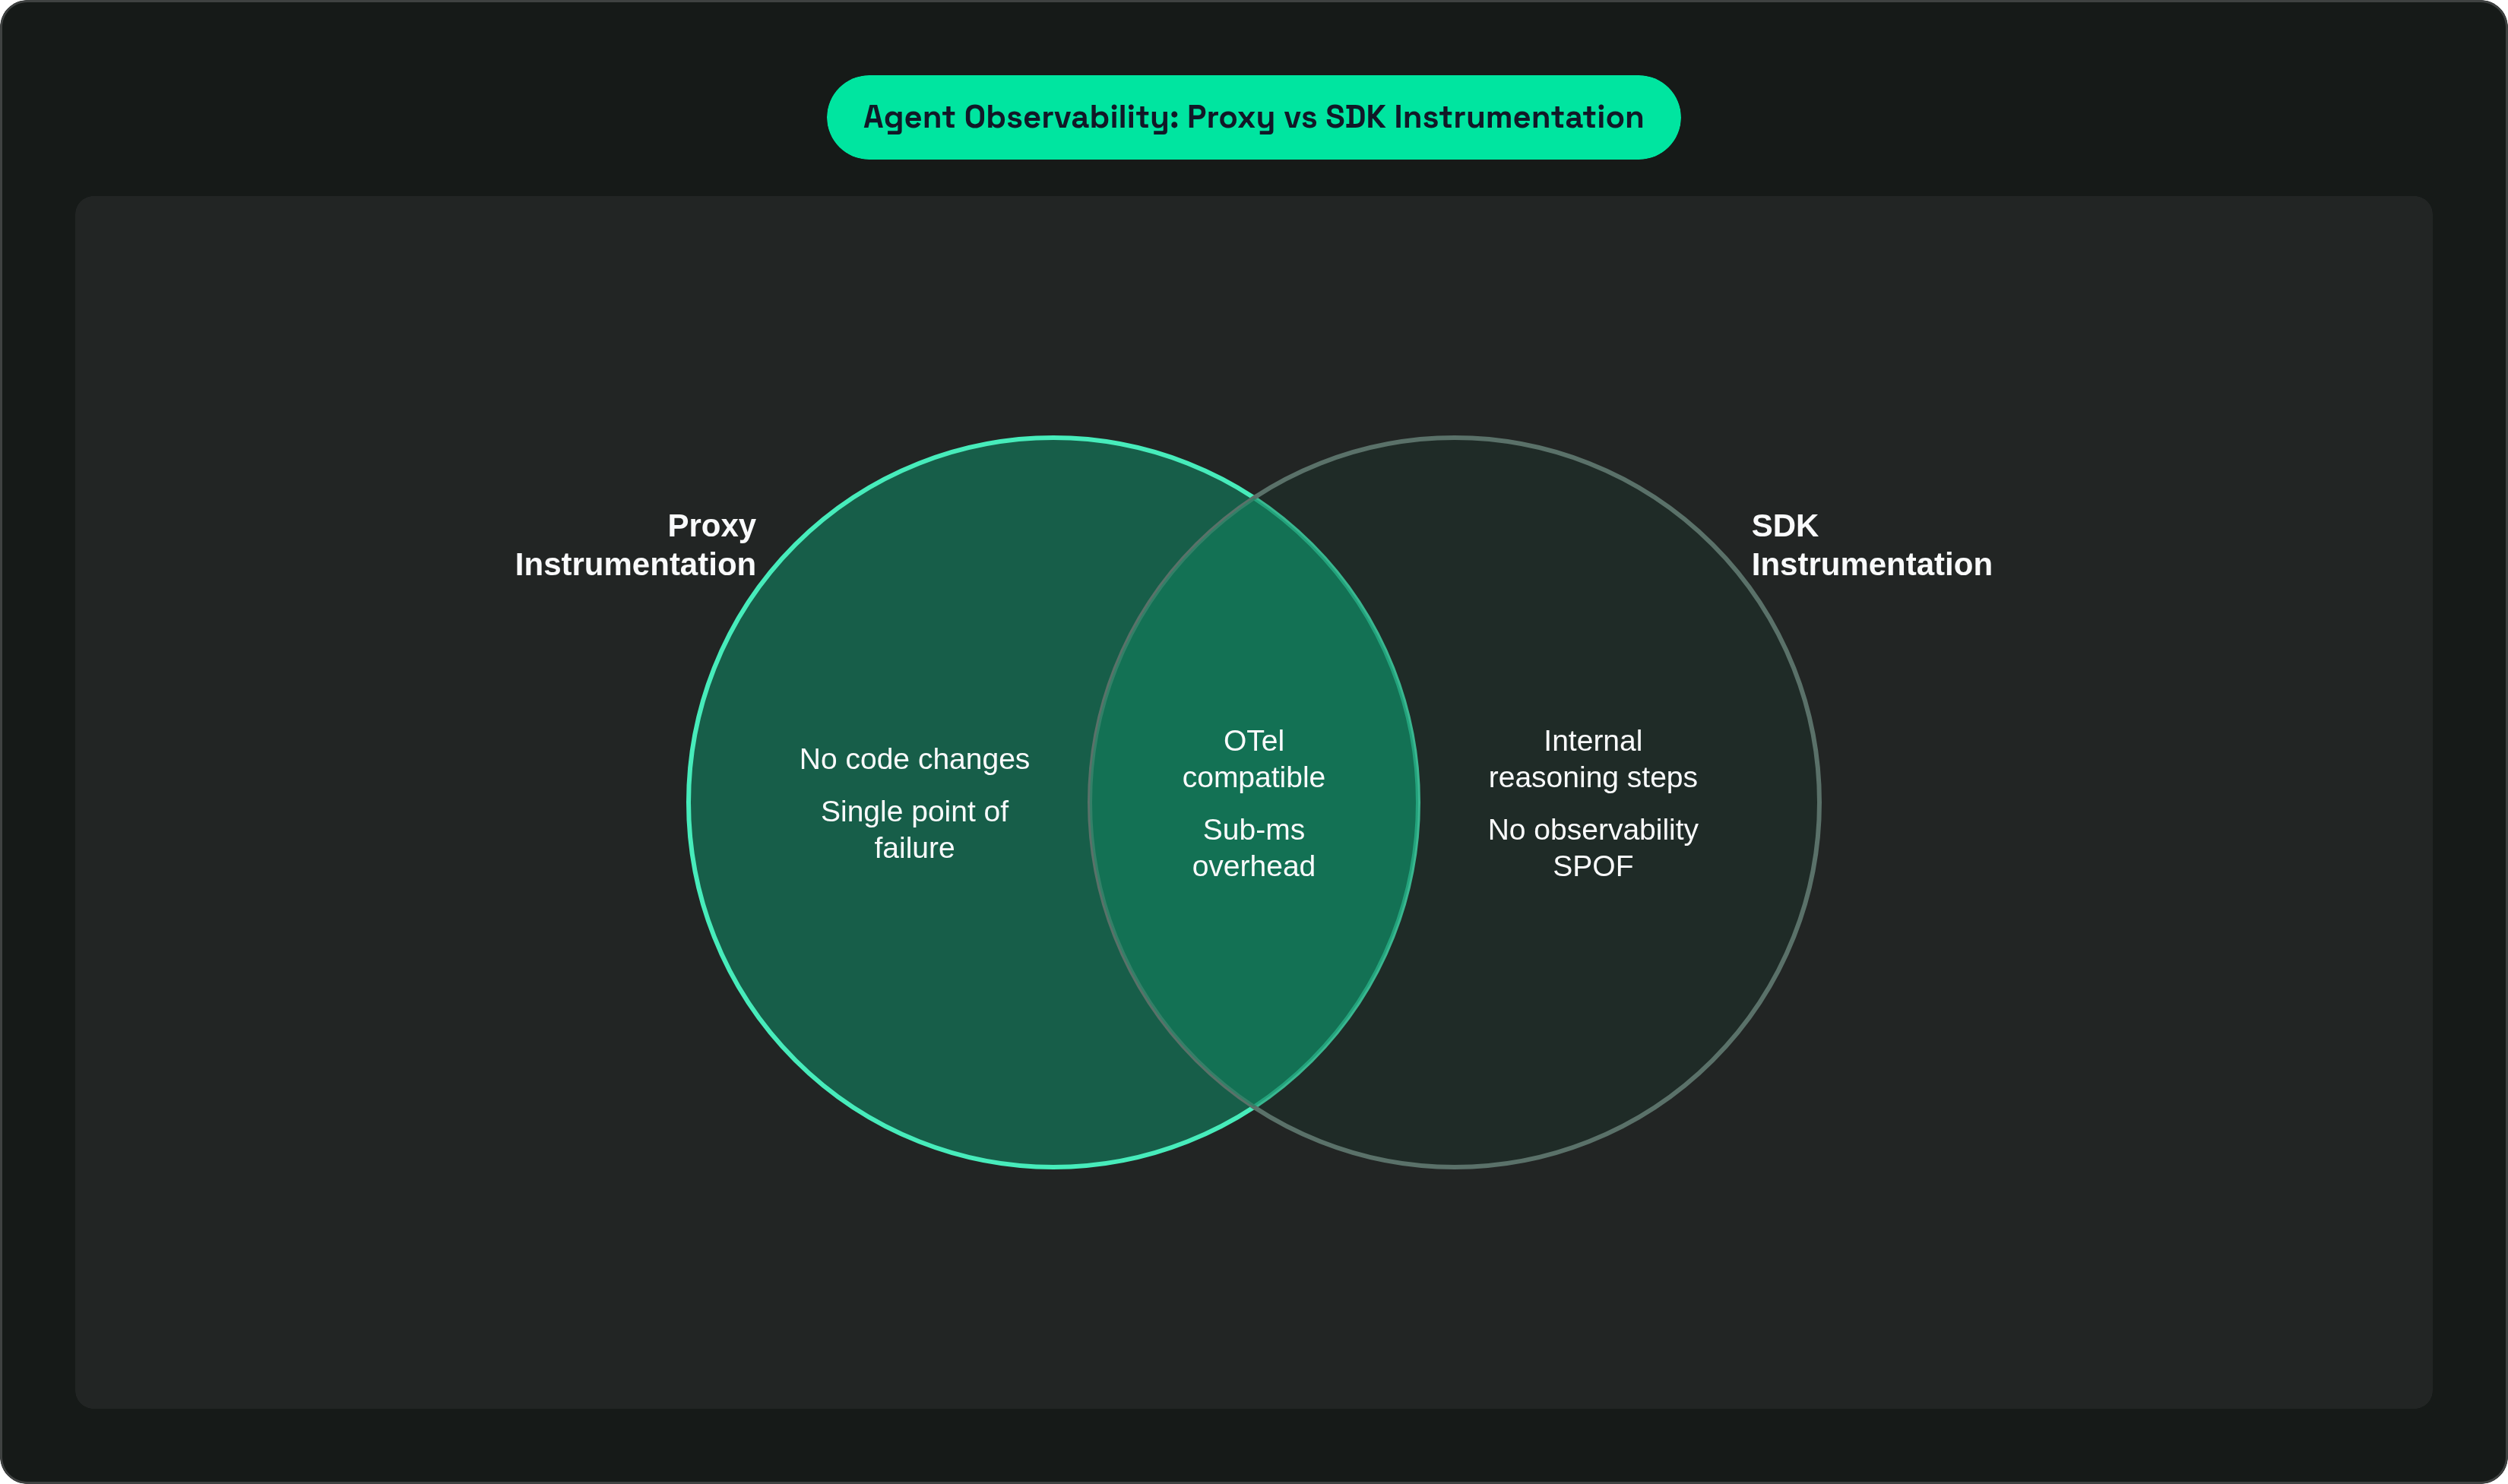
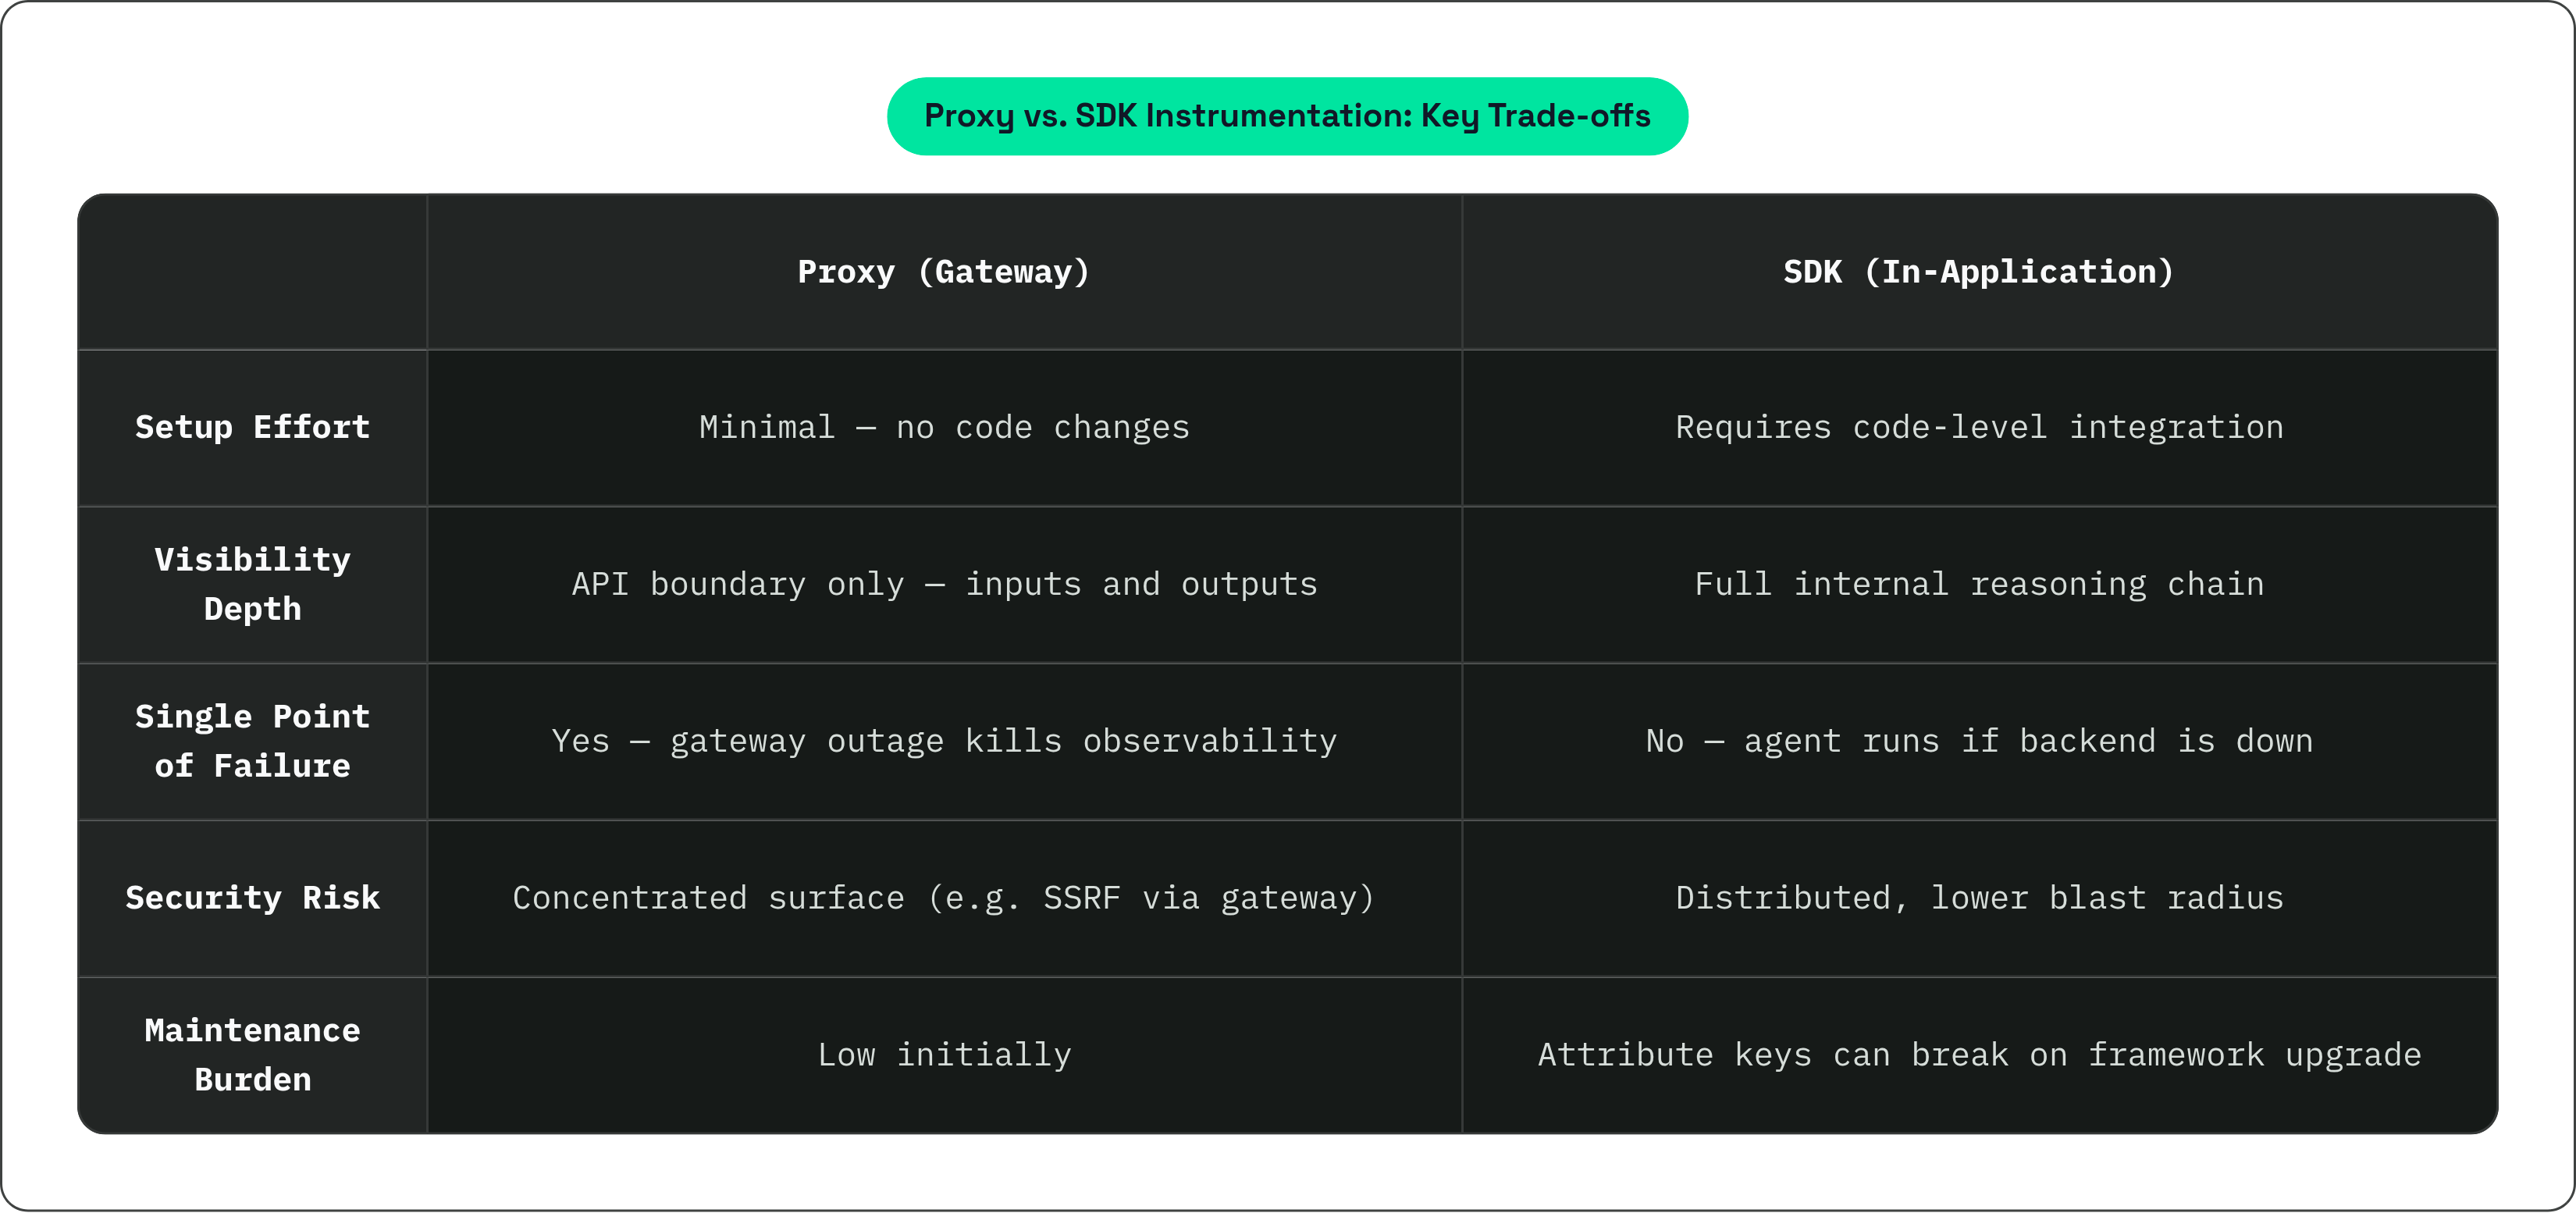
The proxy model puts a gateway in the middle. All LLM calls flow through it. Setup is simple. No code changes required. If you need to get something working fast, this is why teams reach for it.
The problems are structural. The proxy is a single point of failure. If the gateway goes down, your agent observability disappears. That is a bad property to have in a production system. The security surface is also concentrated. Portkey had to patch CVE-2025-66405, an SSRF vulnerability where custom host headers tricked the gateway into hitting internal network resources. One misconfigured gateway, real exposure.
The deeper limitation is visibility. The proxy sees the API boundary; it does not see the reasoning chain. You get inputs and outputs. You do not get the steps between them.
The SDK model instruments inside the application code. You get deeper visibility into the agent's internal reasoning steps. There is no single point of failure for observability. If the backend goes down, the agent keeps running.
The cost here is maintenance. Instrumentation is tied to framework internals. Upgrade the framework, and attribute keys can silently change. Your telemetry breaks without warning, and it is not always obvious that it broke.
One thing that is not the deciding factor: performance overhead. OTel instrumentation adds under a millisecond per call. LLM API latency runs anywhere from 100 milliseconds to 30 seconds. The overhead is irrelevant. What you actually need to manage is storage volume, which is a function of sampling strategy.
The signals that matter: what to capture at each layer of an agent run
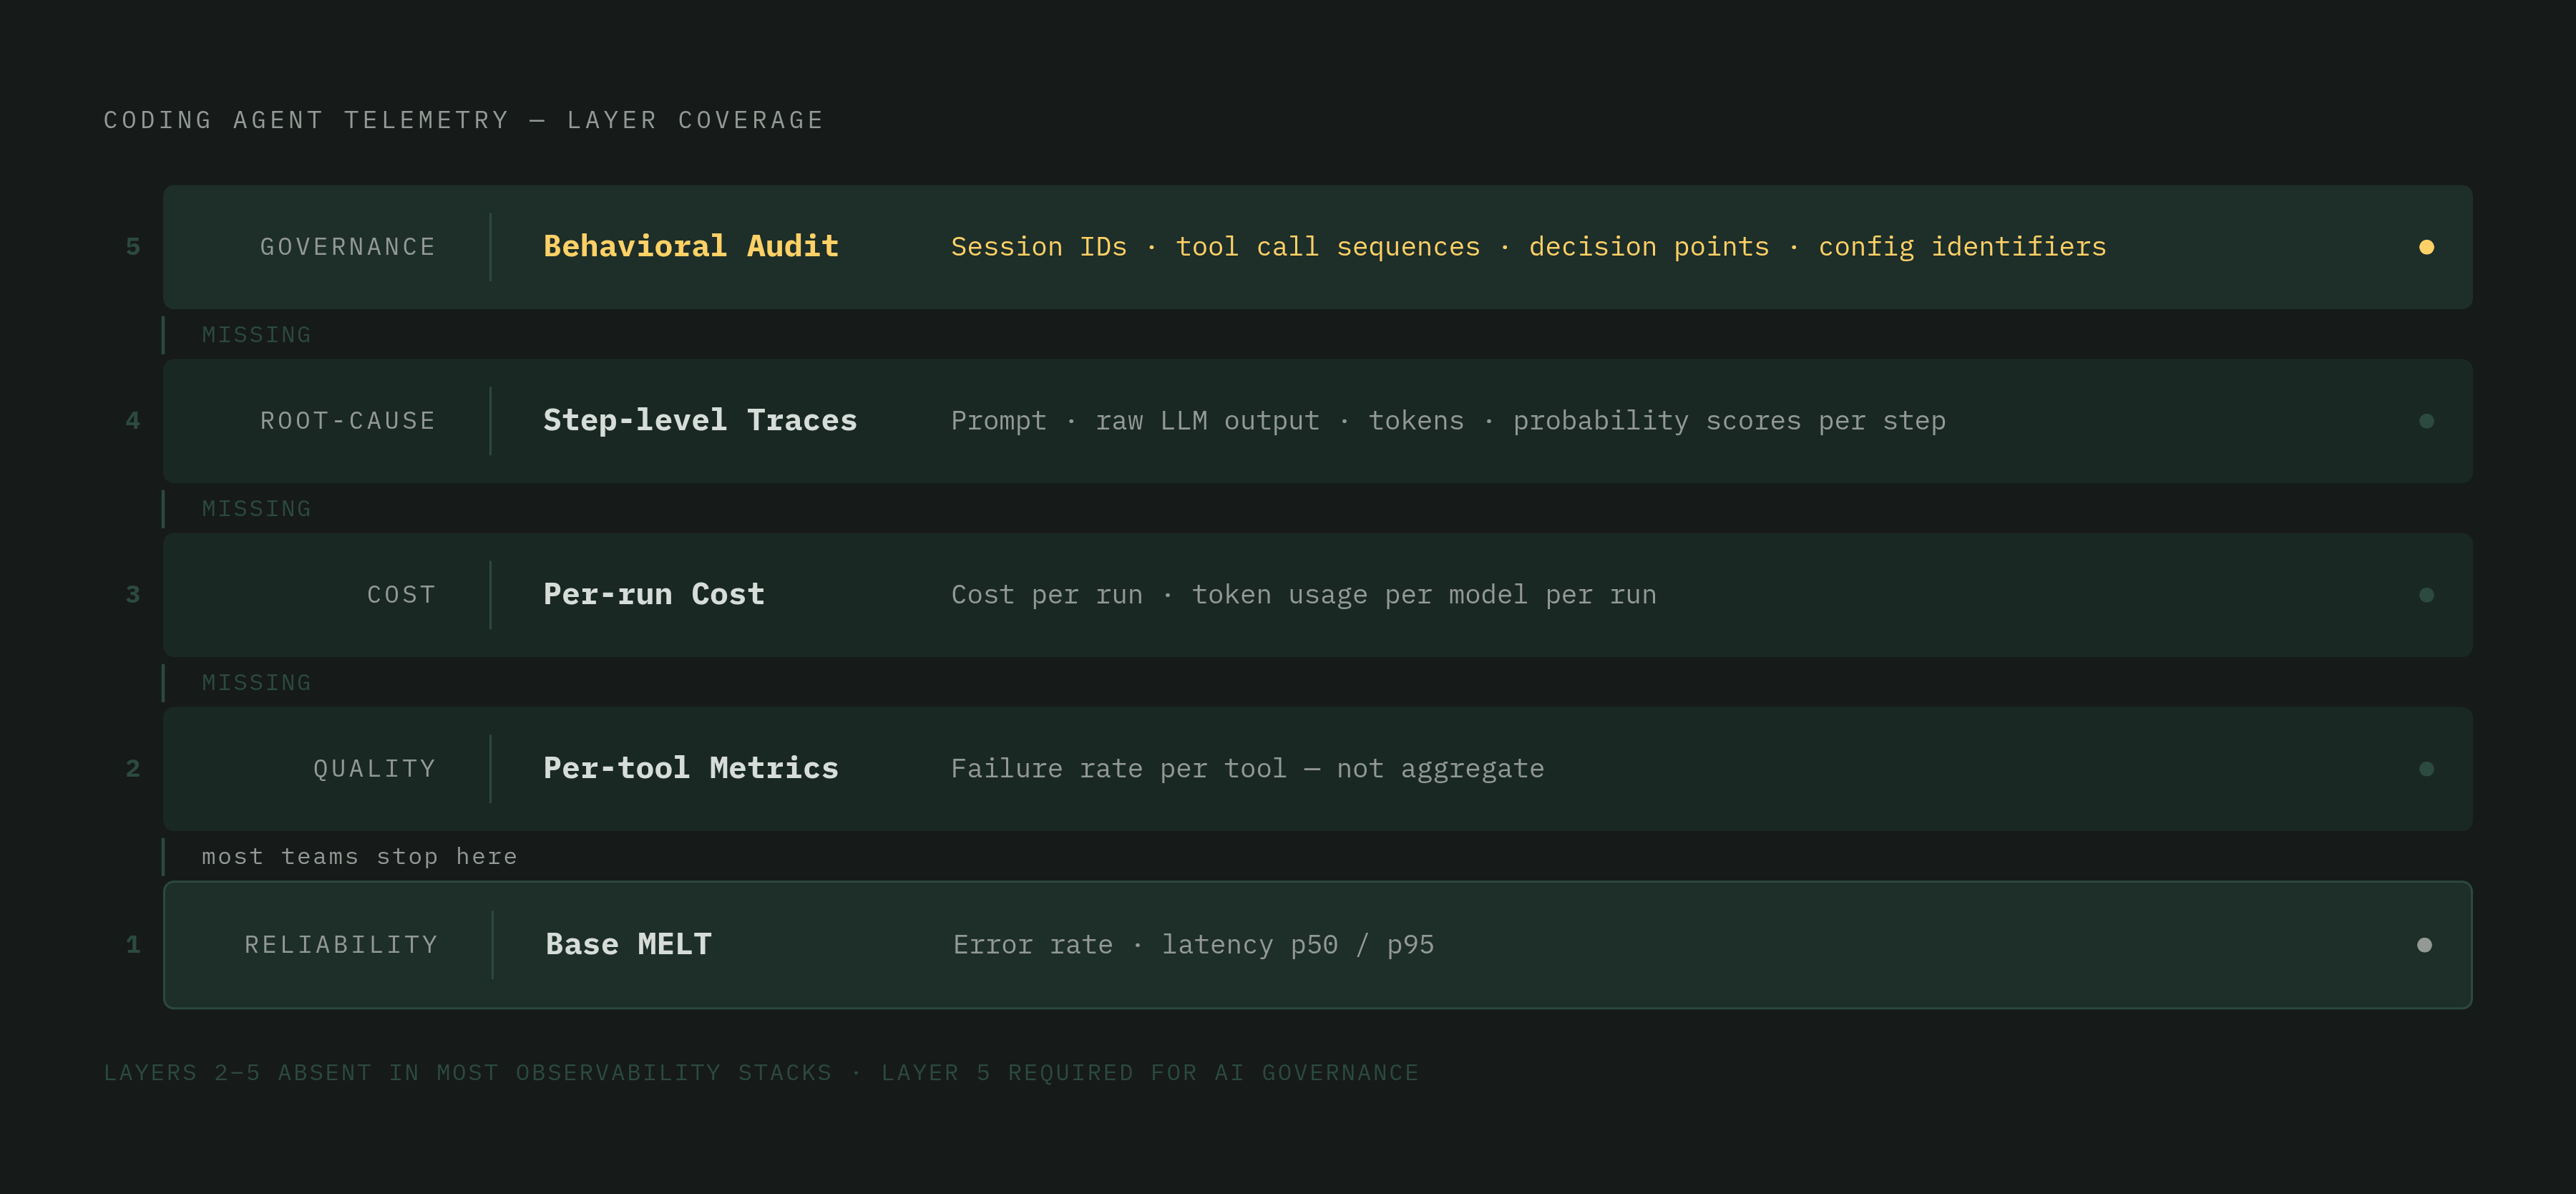
Agent telemetry extends the standard MELT stack (metrics, events, logs, traces) with agent-specific signal layers. The base signals are necessary; they are not sufficient.
Minimum metrics, organized by what question they answer:
For reliability:
- Agent error rate
- Tool failure rate per tool (not aggregate)
- Latency at p50 and p95
For cost:
- Token usage per model per run
- Cost per run (not per request)
- Cache hit rate
For quality:
- Output evaluation scores
- Trend drift alerts tied to model, prompt, and tool config identifiers
A few of these deserve more attention than they usually get.
Tool failure rate must be tracked per tool, not in aggregate. A tool that fails 5% of the time may not move your overall error rate. But it causes roughly 1 in 20 agent runs to produce bad output. Aggregate metrics will hide this completely.
Cost per run is structurally different from cost per request. One run might cost five cents. The next run, triggered by the exact same prompt, might cost two dollars, depending on how many reasoning steps the agent takes. "Cost per run" is the only unit that actually captures agent economics. Per-request cost is almost meaningless in this context.
For step-level traces, capture the specific prompt sent, the raw LLM output, token usage, and any probability scores at each reasoning step. This is what makes replay and root-cause analysis possible. When something goes wrong, you need to see the exact moment a tool returned an error and what the agent did next. Did it retry? Did it degrade gracefully? Did it continue with a corrupted context?
Loop and stall detection is worth building explicitly. Repetitive behavior (same tool called repeatedly, same context state cycling) should trigger a flag before it generates runaway costs or broken outputs.
On sampling: sample at 100% for agent routes. Agent runs are span hierarchies. Sampling below 1.0 drops entire executions, not individual calls. You lose the whole story. Use a head-based sampler configured to keep AI routes at full rate while sampling everything else at your baseline.
How MCP tool boundaries create trace gaps that standard instrumentation misses
Model Context Protocol (MCP), introduced by Anthropic in late 2024, standardizes how agents connect to external tools and data sources. It has moved fast. It is now the integration layer for most production coding agents. And it introduces an observability challenge that standard tracing does not handle well.
The problem is boundary proliferation. An MCP workflow spans the agent runtime, MCP discovery, tool execution, and backend data sources. Standard tracing was designed for service-to-service calls within a known topology; it was not designed to preserve correlation across this kind of layered, dynamic structure.
The specific gap is the discovery phase. When an agent queries which MCP servers are available and what tools they offer, that entire interaction is typically invisible to traces that only instrument tool execution. The discovery step happens. The agent makes a decision based on it. You have no record of it.
The November 2025 MCP specification introduced a Tasks abstraction for tracking multi-step operations. That is progress. But there is still no enforced standard for propagating persistent end-to-end correlation IDs across client, gateway, and backend layers in production deployments. You have to build that yourself.
OWASP recommends using OpenTelemetry or an equivalent framework to trace the full MCP pipeline from prompt creation to tool invocation, tagging every trace with session and schema identifiers. Their MCP Top 10 risks include token exposure, privilege creep, tool poisoning, command injection, and missing telemetry. Notice that last one. Missing telemetry is both the risk and the remediation.
When audit logging is absent across MCP boundaries, organizations lose visibility into what actions agents performed, what data they accessed, and how decisions were made. That is not an abstract concern; it is a direct impairment to incident response and compliance analysis.
Why PII and sensitive data in prompts require redaction at the Collector layer, not the application layer
Agent prompts contain sensitive data. This is not a hypothetical. PII, confidential business data, medical information. It ends up in prompts because that is how agents work. They get context. Context includes real data.
Sending full prompt text to an observability backend without sanitization creates compliance risk under GDPR, HIPAA, and equivalent regimes. Most teams know this. The question is where in the stack to do the redaction. The answer matters more than most people realize.
Why span attributes are the wrong place for prompt content:
Span attributes are always indexed. They have size limits. Putting PII in a span attribute means it is exposed in the observability backend in a queryable, indexed form. That is worse than just logging it. The OTel GenAI conventions handle this correctly by storing content in span events instead. Events can be filtered or dropped at the Collector level without touching application code.
Why application-layer redaction is fragile:
If you redact in a framework callback (a LangChain handler, for example), a future migration to a different framework silently breaks your scrubber. You find out when an auditor asks where the PII went. If you redact in the SDK, an SDK upgrade can quietly change attribute keys, breaking the redaction logic in a way that is not obvious until something downstream flags it.
Why Collector-level redaction is the right architecture:
Collector-level OTTL redaction operates on decoded telemetry data after OTLP ingestion, meaning it works on any signal that crosses the Collector regardless of origin. It does not care what framework generated the data. It does not care what SDK version you are running. It outlives framework migrations and SDK upgrades. This is the only layer that is genuinely framework-agnostic.
The practical implication: redaction strategy should be part of telemetry architecture design from day one. Not retrofitted after a compliance audit.
What governance-ready agent telemetry looks like when traces feed into behavioral audit
There is a gap between "observable" and "governable." A system can emit rich traces and still leave teams unable to answer a simple question: what did the agent decide to do, and why?
Metrics tell you something went wrong. Traces tell you where. Behavioral audit tells you what the agent was actually doing across an entire run, across time, across deployments. That last layer requires more than most teams have built.
What behavioral audit actually requires:
- Persistent session and user IDs on every span, so you can reconstruct full agent runs across time
- Tool call sequences with inputs, outputs, and outcomes recorded. Not just success/failure flags.
- Decision points: where the agent chose one tool over another, where it retried, where it stopped
- Model, prompt version, and tool configuration identifiers attached to spans, so behavioral changes can be correlated to config changes
Drift detection is an operational practice here, not just a monitoring checkbox. You are watching eval scores, latency, and cost trends over time. Not instantaneous health. When trends diverge from a config baseline, that is the signal. Something changed. You need to know what.
The feedback loop this enables is worth naming explicitly. Captured traces of agent decisions become the dataset for evaluating whether the agent's reasoning is improving or degrading across deployments. The telemetry is not just for debugging; it is the foundation for learning.
Here is the organizational reality. Enterprises deploying agents at scale without this instrumentation in place are operating systems they cannot audit, cannot debug efficiently, and cannot govern. The telemetry architecture is not optional infrastructure you add later when things get complicated; it is the precondition for safe delegation. And delegation is already happening.